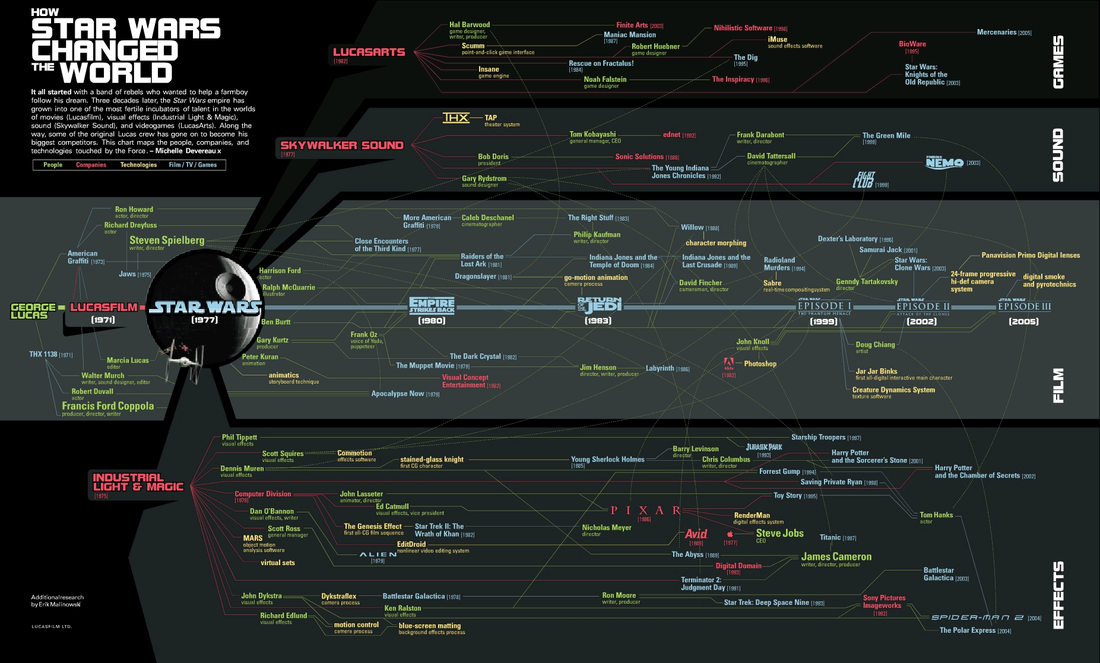
What an appropriate quote for a blog post about infographics and visualizations. As a visual learner, I love infographics. Everything from movie trivia to classroom information is presented in a more appealing and efficient manner for people like me. Some of my students have commented on the panic that sets in when presented with a multi-page document. Infographics allow the user to scan large amount of information in a graphic interface. Often infographics also show relationships like the one below. This is an infographic showing the effect of the Star Wars movies on technological development:
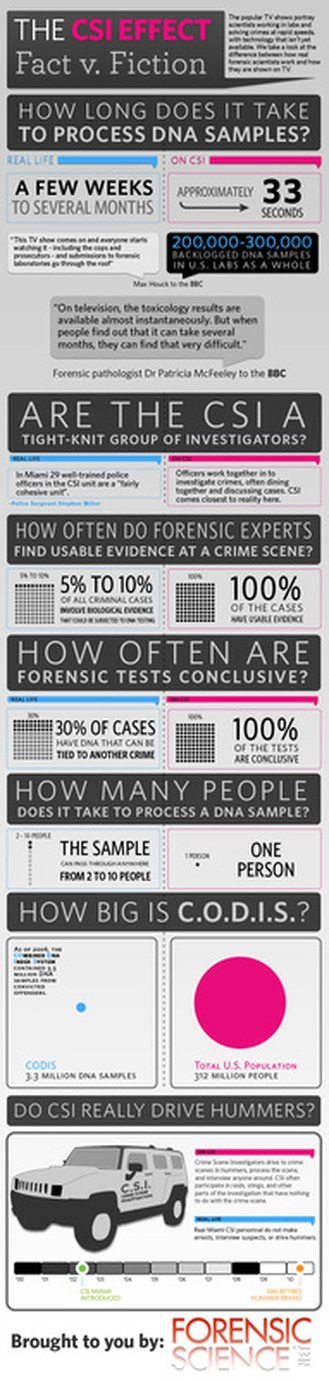
I use the following infographic as the introductory blog post in my forensic science class:
A quick Google search revealed the following infographic that I intend to use in my Earth Science course later this semester:

From word clouds to infographics to pictorial representations of vocabulary, visual learners have more options to help them retain materials than ever before. An added side benefit of these visual representations is that allowing students to create their own infographics or other visual representations can create buy-in from those students who may be more artistically inclined.
As always, thoughts and comments are encouraged.
-Adam
As always, thoughts and comments are encouraged.
-Adam
 RSS Feed
